Coronavirus and Crime – what the COVID is happening in SF?
12 May 2020 • 5 min read
The Coronavirus Crisis has brought my little neighborhood block in Eureka Valley, San Francisco closer together – while we continue our shelter-in-place and keep distance, our online conversations have blossomed into a shared experience.
But that means lots of emails. One morning while reading the many neighborhood messages, one chain letter got my attention.
A neighbor up the block reported that he went down to get his paper at 5am, only to find people in his garage actively burglarizing his place. They escaped in a van.
I looked at the rest of the emails in the chain.
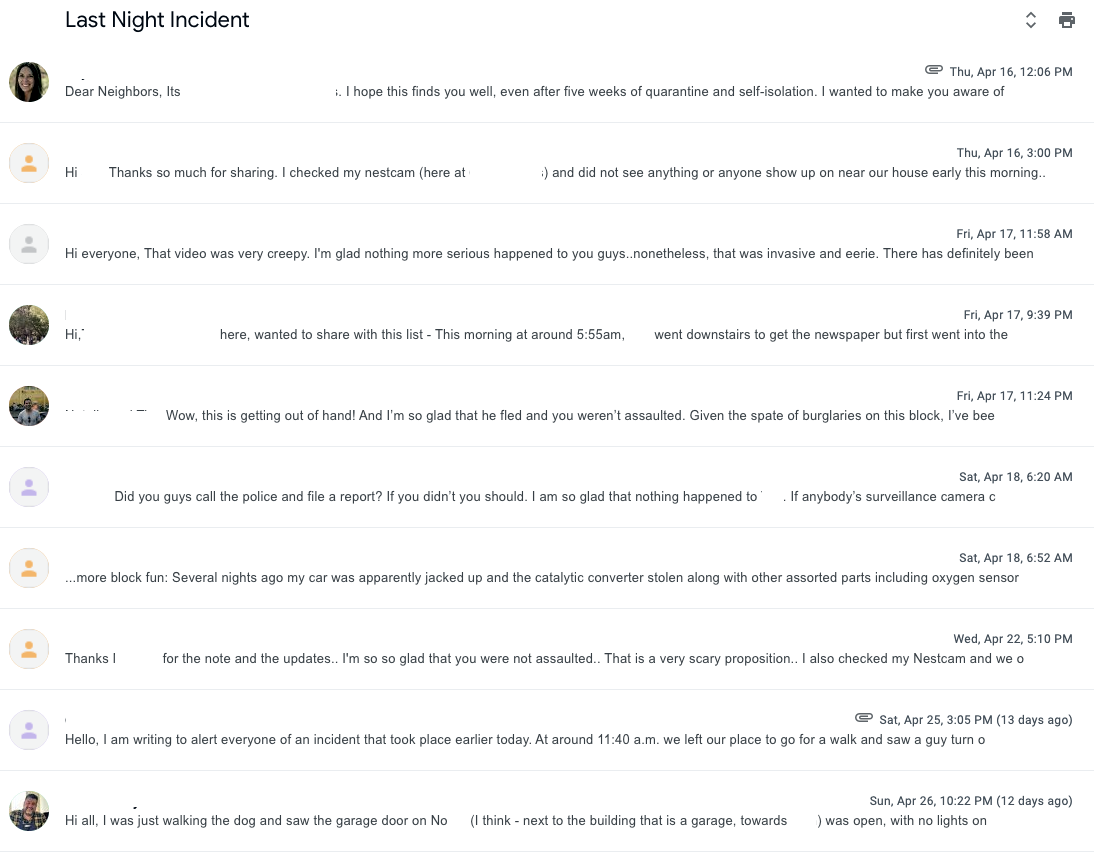
Car break-ins, catalytic converter thefts, garage break-ins, bike thefts – all in the last 4 weeks.
All of this from my neighbors on my one tiny block. I fired up Nextdoor on my phone and found a similar influx of reports. I guess that explains the consistent ding of Citizen App alerts I had been ignoring.
Is crime increasing, or does it just feel that way?
So, this feels bad. But is this just lockdown induced paranoia?
Are we feeling vulnerable, sharing our fears in newfound intimacy?
Or are thieves indeed getting bolder and more desperate?
For my neighbor’s sake, as well as for that of Goodcover’s Members, I had to take a look. After all, theft risk at your location is the single largest factor in our Member’s Renters Insurance premium, accounting for over 38% of every policy’s “base rate”
What is Coronavirus doing to crime?
San Francisco crime is down, but in a very specific way
The below chart shows all incidents of crime reported in San Francisco in two comparable time periods: January to April 2019, and January to April 2020:
San Francisco total crime reported since the stay-at-home order was issued is down around 40%.
So what is driving the change? The below chart shows incidents of crime by category, over the same January to April Period in both 2019 and 2020:
What stands out right away is that “larceny”, or specifically theft of personal property, is SF’s most reported crime by far. And looking at 2019 vs 2020 it’s pretty evident that theft is down.
Larceny seems to be way down, which is good news. But why?
Maybe it’s pickpocketing?
Anybody getting within 6 feet of you is now automatically suspicious, so… makes sense it has collapsed. But the numbers are tiny.
Or shoplifting?
Also collapsed, understandably, but also small numbers.
If you zoom out, you see what drives the larceny numbers.
“Larceny - From Vehicle”, aka car break-ins, dominate the larceny data, but they have fallen off a cliff.
Car break-ins are down, are burglaries and robberies down too?
The data makes a distinction between burglaries (breaking and entering), robbery (theft from a person through intimidation or threat of violence), and other types of thefts such as pickpocketing, shoplifting, theft of items other than personal property.
It does seem that assault and robbery are down by around half. Makes sense – fewer people are out and about – so fewer interactions between humans means fewer opportunities. But other types of crime seem pretty steady. Burglary is up a little bit, but not a huge amount.
So what are my neighbors experiencing?
Today I Learned: "Hot Prowl"
If you look closer at burglaries, while the overall numbers haven’t changed much, there is a subtle shift in the underlying data that may explain why things seem so much worse right now:
Right away by looking at the chart the rise in Commercial Burglaries is apparent, coinciding with the rise in articles like this one from the NY Times.
But it’s Residential Burglary that my neighbors are concerned about. That appears to have gone down. What gives?
If you look closely, there is a rise in “hot prowls”.
This is a term I had never heard before, but now things make sense. A hot prowl is a burglary attempted while the building is occupied. Catch someone in your garage at 5am? That’s a hot prowl in the books, not a residential burglary.
Makes sense. These days, if you are going to burglarize a house, the occupant is probably home. That means less stuff is stolen but it does make burglaries that much more visible and scary.
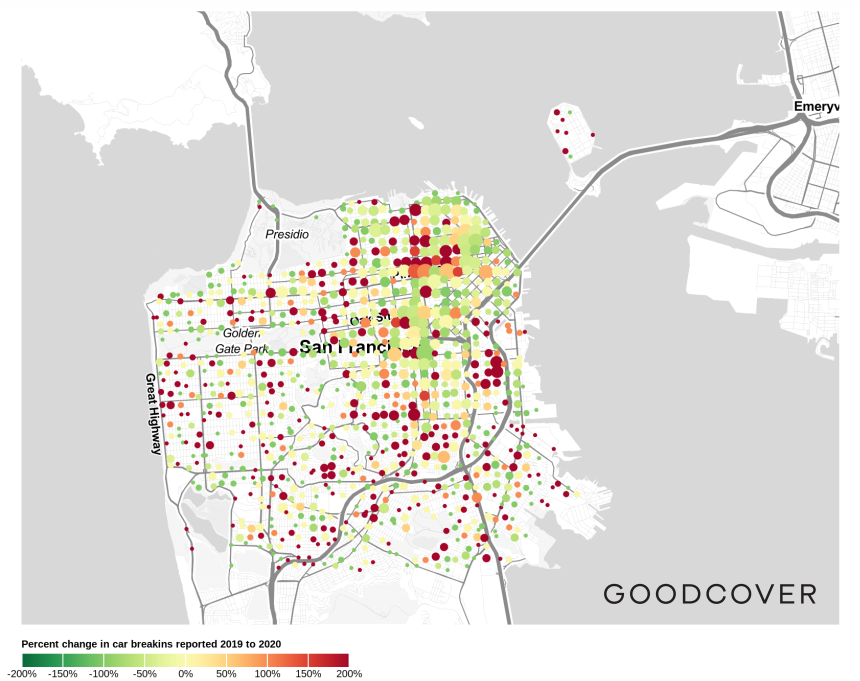
Turns out there is a similar trend in car break-ins
When you look at the above chart, you can see that car break-ins are way down in the commercial corridors along Market and Mission (with the exception of the vicinity of the intersection of Van Ness and California) and in the tourist areas along the wharves.
But if you look at residential areas, break-ins have actually gone up – Sunset, Noe, Bernal Heights, Potrero Hill, Forrest Hill, Glenn Park, Hunters Point – all experiencing 200+% increases. The numbers are small, not big enough to make up for the drop in commercial and tourist areas, but enough to give local residents stuck at home something to notice.
Crime is down, but looks worse because it has moved closer to home
So, crime is generally down, but some of it, especially burglaries where thieves are caught in the act, and car break-ins right outside people's windows, are on the rise.
It makes sense then that in times like these people feel a little extra vulnerable, especially when their neighbors are suddenly catching thieves in their garages and are seeing broken car windows on their block.
But the good news is that while crime has certainly become more visible, the absolute numbers are actually quite low, and more represent a shift in crimes of opportunity, rather than worsening crime over all.
How to protect yourself
- Don't leave anything in your car. Nothing. Nada. Zilch. Many San Franciscans know this already, but it bears repeating.
- Lock Garages with a manual bolt or other physical lock. This has saved at least one of my neighbors after the string of burglaries on my block. While most newer garage-door openers are encrypted, there are still many that aren't, and a thief with a van and a clicker can check a whole block in minutes.
- Report unusual activity to your neighbors first, and quickly. See a garage door randomly open? Notice an open box down the block with your neighbor's address on it? Report it to them privately first. An ounce of prevention is worth a pound of cure.
What else is happening? Check it out for yourself!
Data-diving is fun! Below are the resources I used to compile the data for this analysis.
Raw Data, as downloaded, in CSV, but cut to Jan-April 2019 and Jan-April 2020 so you can do an apples to apples comparison.
Dive in yourself:
- How many arrests have there been for the new category, “Looting during State of Emergency”?
- How many car break-ins actually result in an arrest?
- How many warrants are actually being issued in these times?
Did you find something else interesting? Did you find we were wrong about something? We’d love to know! Email us at hello@goodcover.com.
How are things in your city?
After doing this deep dive on SF, I’ll write again soon with a broader analysis of some major CA cities.
Stay safe everyone.
More stories

Dan Di Spaltro • 8 Jul 2025 • 14 min read
Utah Renters Insurance: The Ultimate Guide

Dan Di Spaltro • 7 Jul 2025 • 14 min read
TN Renters Insurance: Cost, Coverage & Top Providers
Dan Di Spaltro • 4 Jul 2025 • 16 min read
Renters Insurance in Sacramento: A Complete Guide

Dan Di Spaltro • 3 Jul 2025 • 12 min read
Renters Insurance in Louisiana: A Complete Guide

Dan Di Spaltro • 2 Jul 2025 • 16 min read